
15+ Best Financial Analysis Software to Transform Your FP&A Process
Besides Excel, what are the financial analysis software solutions you can use to support your financial operations? Let’s check out this article.
Content Map
More chaptersMicrosoft Excel remains widely used and trusted across industries, even after 40 years in use. By offering versatility, from simple spreadsheets to advanced modeling, analytics, and dashboards, Excel is still considered a safe choice for daily financial workflows. However, as financial needs grow more complex with evolving financial activities, Excel reveals its limitations, such as:
- Prone to crashing when the data grows
- Provide no real-time collaboration
- Cannot connect directly with ERP, CRM, HR, and BI systems
- Pose data leakage risks when shared through email or local drives.
- Lack of automation & prone to manual errors
This is where financial analysis software comes in and helps businesses regardless of size, elevating the financial operations with automation, collaboration, and intelligence that spreadsheets can’t match.
According to Gartner, the global financial management software market is expected to grow robustly, reaching $24.4 billion by 2026. This figure partly reflects the fiercely competitive market, and also emphasizes the difficulty of users in choosing the right financial tool.
If you’ve ever wrestled with broken formulas or version of chaos, it’s time to look beyond Excel. This article will give you some clues for the best fit.
Comprehensive Financial Analysis Platforms
These combine accounting, forecasting, budgeting, and reporting features in one system.

QuickBooks
QuickBooks is a financial analysis and accounting platform developed and marketed by Intuit. With an easy-to-use interface, QuickBooks is a popular choice for small to mid-sized businesses that need to modernize their financial operations. The tool provides almost all the necessary accounting features, such as financial reporting, financial planning, and expense tracking, to help users manage their finances more effectively. With the rapid development of AI, QuickBooks also includes AI-powered features, namely batch transactions, category suggestions, and AI-designed agents, improving 24/7 automation efficiency for routine financial tasks.
QuickBooks is available in multiple versions, with the two main ones being QuickBooks Online (a cloud-based version that users can access from any device with an internet connection) and QuickBooks Desktop (a locally installed version that runs on Windows or Mac). All have the ability to seamlessly integrate with Excel and third-party tools, enabling you to export or sync data for deeper, customized financial analysis.
QuickBooks is ideal for:
- Managing day-to-day accounting.
- Generating cash-flow, profit-and-loss, and balance-sheet reports.
- Automating payroll processing and tax calculations for small teams.
- Tracking project or job costs for service-based businesses.
- Handling inventory and sales for retail businesses with simple product catalogs.
Oracle NetSuite
More than accounting software, NetSuite is a cloud-based business management software suite delivered via a SaaS model. It integrates key enterprise systems, such as ERP (Enterprise Resource Planning), CRM (Customer Relationship Management), financials, inventory and order management, e-commerce, and more - all in a unified platform. Therefore, this tool is especially suitable for businesses seeking comprehensive financial management solutions.
With the help of Oracle NetSuite, users have a real-time, 360° view of their own operations without the burden of managing on-premises infrastructure. Being “built for the cloud” means the solution is faster, more secure, easier to maintain, and infinitely more scalable than older systems that were simply moved online. However, the wide range of complex features integrated also makes NetSuite have a steep learning curve and is difficult to approach for beginners.
Oracle NetSuite is ideal for:
- Centralizing accounting, inventory, CRM, and operations into one unified platform.
- Automating financial processes.
- Managing complex, multi-entity or multi-location operations with real-time visibility.
- Scaling operations quickly without rebuilding systems.
- Supporting global operations with multi-tax and compliance features.
Workday Adaptive Planning
Workday Adaptive Planning is a powerful cloud-based financial planning and analysis (FP&A) software for financial planning and analytics. Formerly known as Adaptive Insights, it provides finance teams with diverse functionalities, including modeling, tools, real-time dashboards, and collaborative planning workflows, enabling organizations to move beyond static spreadsheets and achieve more agile financial planning.
In addition to its ability to easily integrate with other systems such as ERP, Salesforce automation, and CRM, Workday Adaptive Planning can also link with other systems in the Workday ecosystem, such as Workday Financial Management, for example, to optimize processes without heavy IT support.
Workday Adaptive Planning is ideal for:
- Streamlining budgeting, forecasting, and long-range planning across departments.
- Centralizing financial and operational data.
- Running what-if scenarios to test assumptions and evaluate the financial impact.
- Scaling planning processes for fast-growing organizations without relying on IT.
- Automating consolidation of spreadsheets and month-end planning tasks.
SAP Analytics Cloud
SAP Analytics Cloud (SAC) is a multi-purpose enterprise analytics platform that includes strong financial analysis and planning capabilities. The platform unifies business intelligence (BI), enterprise planning, augmented analytics, and predictive capabilities into one application. Its strengths include BI and data visualization, driver-based planning, AI-powered security, etc. As a cloud solution, SAC helps users receive regular updates and scales as their business grows without heavy infrastructure investment.
Built on SAP’s Business Technology Platform, it integrates seamlessly with SAP S/4HANA, SAP HANA, ERP systems, and external data sources, giving businesses a complete financial picture without relying on spreadsheets or disconnected tools.
SAP Analytics Cloud is ideal for:
- Analyzing financial performance through real-time dashboards and customizable reports.
- Predicting future trends with built-in AI tools.
- Collaborating across finance, operations, and leadership teams with shared data models.
- Automating financial workflows.
- Supporting operations that require governance, auditability, and high data accuracy.
Business Intelligence (BI) & Data Visualization Tools
Used to analyze and visualize complex financial data from multiple systems.
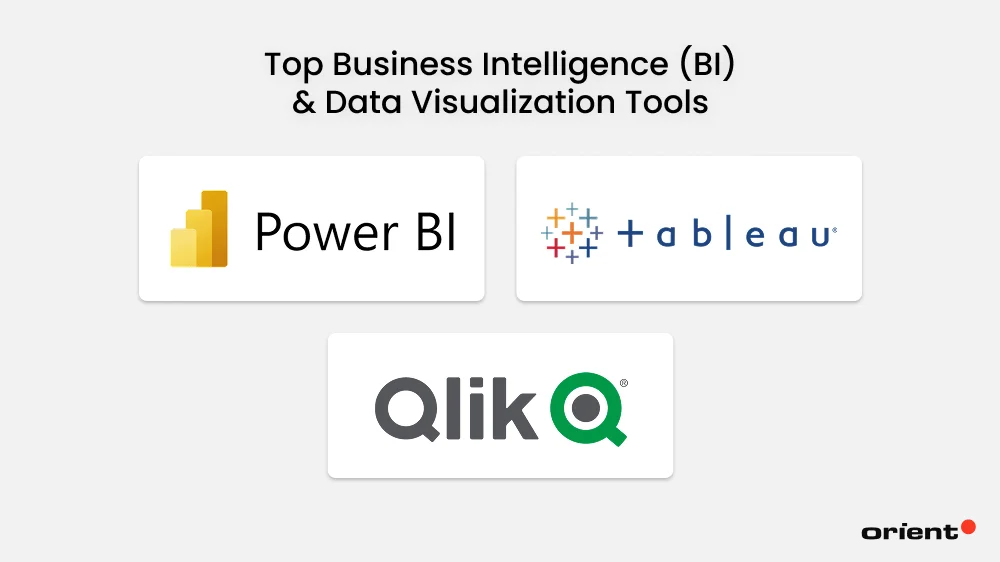
Microsoft Power BI
Microsoft Power BI is one of the most popular business intelligence and data visualization tools on the market. By connecting to multiple data sources (with user consent), the tool can transform raw information into interactive dashboards and generate real-time insights for better decision-making in a snap. As part of the Microsoft ecosystem, Microsoft Power BI integrates seamlessly with Excel, Azure, SQL Server, Dynamics 365, and hundreds of third-party applications, making it highly versatile for both technical and non-technical users.
Like many other solutions, Microsoft Power BI is cloud-enabled, which means users can access it anywhere and at any time, leveraging data refresh automation and collaboration across teams without relying on manual reporting.
Microsoft Power BI is ideal for:
- Visualizing operational, customer, and (historical) financial data through interactive dashboards.
- Connecting multiple data sources (from Excel, SQL databases, ERPs, CRMs, cloud apps) into one unified view.
- Analyzing KPIs and performance metrics in real time.
- Sharing insights across teams through cloud-based dashboards.
- Embedding analytics into existing workflows.
Tableau
Tableau is a leading business intelligence and data visualization platform designed to help companies explore, analyze, and present data through highly interactive and visually compelling dashboards. Known for its drag-and-drop interface and strong visual analytics engine, Tableau allows users to turn a large volume of datasets into actionable insights and make better-informed decisions without requiring deep technical skills.
Because the strength of this financial analysis software is real-time data and fast analytics, Tableau allows data integration from a wide range of data sources, from spreadsheets and cloud apps to enterprise databases like SQL Server, Snowflake, and Oracle. This helps simplify data analysis and makes financial reporting more efficient than ever.
Tableau is ideal for:
- Visualizing complex datasets through high-quality charts.
- Exploring data intuitively using drag-and-drop analytics without the need for coding skills.
- Analyzing trends and performance metrics across large data sources.
- Combining multiple data sources.
- Supporting enterprise-scale analytics.
Qlik Sense
Qlik Sense is a self-service business intelligence and data analytics platform that allows users to create interactive dashboards and reports through a powerful associative analytics engine. Unlike traditional BI tools that follow linear or query-based analysis, this tool combines data from multiple sources using proprietary linking technology, allowing users to freely navigate data relationships and uncover hidden insights that standard SQL queries may miss.
Qlik Sense offers versions such as Qlik Sense Enterprise for cloud-based or on-premise analytics, Qlik Sense Desktop for Windows computers, and mobile apps for iOS/Android. It’s widely used by organizations that need fast, intuitive analytics with the ability to explore data from any angle without predefined constraints.
Qlik Sense is ideal for:
- Exploring data from multiple angles.
- Combining data from diverse sources.
- Supporting enterprise use cases with strong governance and security.
- Automating data preparation and reporting workflow.
- Building interactive dashboards and visualizations without needing predefined query paths.
Forecasting & Financial Modeling Tools
For deeper financial modeling, scenario simulation, and valuation.
Anaplan
Anaplan is a cloud-based financial reporting software designed for planning, forecasting, and financial modeling across finance, sales, supply chain, HR, and operations. Built on its powerful Hyperblock™ engine, the tool enables businesses to connect data from multiple sources, simulate different scenarios, and make better decisions in real-time with unmatched speed and flexibility.
By centralizing data into a unified environment, Anaplan creates a scalable environment where different teams can create driver-based plans, perform what-if analyses, and update forecasts instantly as assumptions change. While it is a popular choice for mid-size to large enterprises that require dynamic planning, multi-dimensional models, and cross-functional capabilities to support strategic decision-making, in some cases, users report complexity when integrating the tool with large datasets (especially if the integration architecture is not optimized).
Anaplan is ideal for:
- Building large-scale, multi-dimensional financial models that update in real time.
- Running complex what-if scenarios.
- Connecting finance, sales, supply chain, HR, and operations planning into one unified platform.
- Collaborating across departments using shared workflows.
- Automating routine planning tasks, reporting, and reconciliation to speed up FP&A cycles.
Quantrix
Quantrix is a multi-dimensional financial forecasting software developed to replace the weaknesses of traditional spreadsheet tools. Instead of using a two-dimensional grid like Excel, Quantrix allows users to leverage a multi-dimensional approach and build complex models with plain-language formulas and visualize data from various sources without breaking formulas.
This tool also doesn’t require users to commit to a full enterprise planning system like Anaplan or Workday, and instead focuses on advanced financial modeling capabilities. If your business is looking for financial analysis software that excels in flexible financial models, scenario analysis, and multi-dimensional forecasting, Quantrix may be a suitable alternative for your finance teams.
Quantrix is ideal for:
- Building multi-dimensional financial models that go beyond Excel’s two-dimensional structure.
- Forecasting multiple scenarios and assumptions without breaking formulas.
- Centralizing calculations using its “formula-in-one-place” approach.
- Supporting strategic planning, budgeting, valuation, and operational modeling needs without adopting a full enterprise planning suite.
Vena Solutions
Vena Solutions is a cloud-based financial planning and analysis (FP&A) platform specialized for enhancing budgeting, forecasting, reporting, and financial modeling. Instead of completely replacing Excel, Vena Solutions keeps this traditional spreadsheet at the core of its user experience. The tool is built on Excel by adding a secure, centralized database, workflow automation, version control, and enterprise-level collaboration features. By keeping the flexibility of Excel and eliminating the typical risks such as broken formulas, multiple versions, inconsistent data, and manual consolidation, Vena is the optimal choice for organizations that want to modernize their FP&A processes but prefer to retain Excel as their primary modeling interface.
The downside of this financial data software is its limited integration, as in some cases, Vena requires users to use an additional Vena API to enable it to integrate with other technologies.
Vena Solutions is ideal for:
- Enhancing existing Excel with a centralized database and controlled workflows.
- Reducing errors caused by manual spreadsheets while maintaining Excel’s flexibility.
- Modernizing FP&A processes for organizations that prefer to keep Excel at the center of their modeling.
- Automating data consolidation, version control, and approval workflows.
Investment & Valuation Analysis Tools
For investment banking, portfolio management, and corporate finance teams.
FactSet
FactSet is a leading financial data, analytics, and research platform used extensively by investment professionals, such as asset managers, investment banks, private equity firms, and corporate finance teams. At its core, FactSet aggregates millions of data points from thousands of global sources (e.g., equities, fixed income, derivatives, commodities, M&A deals, ownership structures, ESG metrics, corporate filings, market news) into a single, unified platform.
By consolidating data on economic indicators, public and private companies, and fixed-income portfolios into a single integrated environment, FactSet can deliver accurate real-time and historical data across global markets and eliminate the need for manual data collection, helping analysts improve equity research and valuation model development. Customizable dashboards, Excel integrations, and screening tools are some of the tool’s standout features.
FactSet is ideal for:
- Aggregating diverse financial data sources into a single platform.
- Building valuation models with real-time data pulled directly into Excel.
- Conducting deep equity, fixed-income, and market research using comprehensive global datasets.
- Analyzing portfolio performance, risk factors, and market exposures.
- Supporting investment decisions across financial aspects.
Morningstar Direct
Morningstar Direct is a web-based investment research and portfolio management platform widely used by financial analysts, wealth advisors, institutional investors, and marketers. Instead of having to conduct research and collect data manually, Morningstar Direct provides deep data and analytics on mutual funds, ETFs, equities, and managed portfolios for various investment products, all backed by its renowned independent research and proprietary ratings (e.g., Morningstar Star Rating, Analyst Rating, ESG Ratings, and Portfolio Sustainability Scores).
In addition to providing data, this tool also has powerful tools for performance analysis, risk assessment, portfolio construction, and peer comparison, so users can not only access data but also evaluate investment products with a high level of detail and consistency. Because it centralizes everything an analyst needs in one environment, Morningstar Direct is widely used across the investment lifecycle, from security selection and due diligence to ongoing portfolio monitoring and performance reporting.
Morningstar Direct is ideal for:
- Analyzing investments using deep datasets.
- Comparing securities across thousands of metrics.
- Researching market trends and securities with access to global data.
- Evaluating portfolio performance with tools for attribution, benchmarking, and risk assessment.
- Constructing portfolios using factor analysis, scenario testing, and asset allocation models.
Bloomberg Terminal
Bloomberg Terminal is a premier computer software platform that provides real-time market data, news, financials, analytics, and trading capabilities across every major asset class to investment professionals worldwide. As an all-in-one system, it is commonly used to serve the purpose of monitoring global markets for equities, currencies, bonds, commodities, and more.
More than just a data platform, the Terminal is accessed through dedicated computer terminals and includes customizable tools for proprietary research, portfolio analysis, trading, risk modeling, charting, and valuation. Its messaging system, which is called Instant Bloomberg (IB), has a reputation throughout the global finance industry for being the trusted network for high-stakes and real-time market communication. With unmatched market coverage and speed, Bloomberg Terminal is considered one of the most authoritative sources for reliable financial insights and decision-making.
Bloomberg Terminal is ideal for:
- Accessing real-time market data across every asset class.
- Benchmarking performance against market indices and custom peer groups.
- Monitoring global financial news and economic events.
- Trading directly from the platform with integrated order management and execution tools.
- Communicating securely with traders, brokers, and financial professionals.
AI-Powered & Predictive Financial Analysis
Modern platforms that use machine learning and GenAI for smarter insights.
Datarails
Datarails is one of the trusted financial analysis software tools powered by AI technology to automate real-time financial reporting, budgeting, forecasting, and variance analysis, without completely replacing the role of Excel. By allowing finance teams to continue working in Excel when using Datarails, this tool enables users to access a centralized, cloud-based database and utilizes machine learning to automatically clean, consolidate, and analyze financial data.
To achieve this, Datarails follows the workflow: first pulling data from ERP, CRM, HR, and accounting systems, then using AI to deliver insights, detect anomalies, and highlight trends. This automated process saves users hours spent on manual work like consolidating spreadsheets or preparing reports, enabling finance teams to focus on strategic analysis rather than data wrangling.
Datarails is ideal for:
- Automating the consolidation of Excel-based budgets, forecasts, and financial reports.
- Integrating data from sources into a centralized, structured database.
- Analyzing variances and performance trends using AI-driven insights.
- Supporting small and mid-sized finance teams that want AI enhancements without replacing Excel.
- Speeding up FP&A cycles.
Planful
Planful, formerly Host Analytics, is a cloud-based FP&A (Financial Planning & Analysis) platform that helps businesses replace manual spreadsheet workflows with automated processes, centralized financial data, and collaborative planning environments. It focuses on simplifying financial processes, accelerating closing, and enhancing analytics for modern finance teams looking to modernize.
In addition to providing essential tools for driver-based planning, rolling forecasts, scenario modeling, and month-end close management, Planful also includes built-in AI and machine learning features such as predictive forecasting and anomaly detection to help businesses identify trends, improve accuracy, and make faster, data-driven decisions.
Planful is ideal for:
- Streamlining budgeting, forecasting, and financial close processes across departments.
- Running driver-based and rolling forecasts.
- Modeling multiple what-if scenarios.
- Leveraging AI-driven insights for predictive forecasting and anomaly detection.
- Supporting mid-market and enterprise finance teams that need scalable, collaborative FP&A workflows.
Pigment
Pigment is a modern, cloud-based business planning and financial modeling platform designed to help organizations plan, forecast, and analyze performance in a highly flexible and collaborative environment. Built as a next-generation alternative to legacy FP&A tools and spreadsheet-heavy workflows, Pigment combines multi-dimensional modeling, interactive dashboards, and real-time collaboration in one intuitive interface.
The platform allows finance, sales, operations, and HR teams to build driver-based plans, run what-if scenarios, and update forecasts instantly as assumptions change. Without the fragility or formula overload found in spreadsheets, Pigment leverages its powerful calculation engine to support large, complex models and streamline processes. With strong integrations to ERP, CRM, HRIS, and BI tools, Pigment centralizes data into a single source of truth, making it easier for organizations to transition from reactive reporting to proactive, strategic planning.
Pigment is ideal for:
- Running fast, interactive what-if scenarios.
- Centralizing data from ERP, CRM, HRIS, and BI tools into a unified planning environment.
- Automating budgeting, forecasting, and reporting workflows.
- Visualizing performance through interactive dashboards and dynamic charts
- Supporting fast-growing companies that need scalable, modern planning tools with strong usability.
Final Thoughts

Using modern financial report analysis tools doesn’t mean abandoning Excel entirely. In addition to modernizing finance operations with the solutions introduced above, businesses can combine Excel with one or more advanced software to get the best of both worlds.
Keep Excel for what it is best at, such as quick calculations, ad-hoc analysis, or one-off reports; and use platforms like Anaplan for heavy data processing, forecasting, automation, and collaboration. Some financial tools even offer direct integration with Excel, helping you simplify the process of importing/exporting and syncing data.
For example, a business uses Power BI dashboards but lets finance professionals fine-tune the underlying data in Excel. By doing this, you keep Excel safe while extending its capabilities with platforms that handle scale, automation, and real-time collaboration.